| ||||||||||||||
| Miami County, Ohio | ||
 County courthouse in Troy
| ||
| ||
 Location in the state of Ohio | ||
 Ohio's location in the U.S. | ||
| Founded | March 1, 1807[1] | |
|---|---|---|
| Named for | Miami people | |
| Seat | Troy | |
| Largest city | Troy* | |
| Area - Total - Land - Water |
410 sq mi (1,062 km²) 407 sq mi (1,054 km²) 3.1 sq mi (8 km²), 0.8% | |
| Population - (2020) - Density |
108,774 auto/sq mi (Expression error: Unrecognized word "auto"./km²) | |
| Congressional district | 8th | |
| Time zone | Eastern: UTC-5/-4 | |
| Website | www.MiamiCountyOhio.gov | |

Miami County is a county located in the U.S. state of Ohio. As of the 2020 census, the population was 108,774.[2] Its county seat is Troy.[3] The county is named in honor of the Miami people.[4]
Miami County is part of the Dayton, OH Metropolitan Statistical Area.
Geography[]
According to the U.S. Census Bureau, the county has a total area of 410 square miles (1,100 km2), of which 407 square miles (1,050 km2) is land and 3.1 square miles (8.0 km2) (0.8%) is water.[5]
Adjacent counties[]
- Shelby County (north)
- Champaign County (northeast)
- Clark County (southeast)
- Montgomery County (south)
- Darke County (west)
Demographics[]
| Historical populations | |||
|---|---|---|---|
| Census | Pop. | %± | |
| 1810 | 3,941 | ||
| 1820 | 8,851 | 124.6% | |
| 1830 | 12,807 | 44.7% | |
| 1840 | 19,688 | 53.7% | |
| 1850 | 24,999 | 27.0% | |
| 1860 | 29,959 | 19.8% | |
| 1870 | 32,740 | 9.3% | |
| 1880 | 36,158 | 10.4% | |
| 1890 | 39,754 | 9.9% | |
| 1900 | 43,105 | 8.4% | |
| 1910 | 45,047 | 4.5% | |
| 1920 | 48,428 | 7.5% | |
| 1930 | 51,301 | 5.9% | |
| 1940 | 52,632 | 2.6% | |
| 1950 | 61,309 | 16.5% | |
| 1960 | 72,901 | 18.9% | |
| 1970 | 84,342 | 15.7% | |
| 1980 | 90,381 | 7.2% | |
| 1990 | 93,182 | 3.1% | |
| 2000 | 98,868 | 6.1% | |
| 2010 | 102,506 | 3.7% | |
| U.S. Decennial Census[6] 1790-1960[7] 1900-1990[8] 1990-2000[9] 2020 [10]> | |||
2000 census[]
As of the census[11] of 2000, there were 98,868 people, 38,437 households, and 27,943 families living in the county. The population density was 243 people per square mile (94/km2). There were 40,554 housing units at an average density of 100 per square mile (38/km2). The racial makeup of the county was 95.78% White, 1.95% Black or African American, 0.19% Native American, 0.79% Asian, 0.01% Pacific Islander, 0.28% from other races, and 1.00% from two or more races. 0.73% of the population were Hispanic or Latino of any race.
There were 38,437 households, out of which 33.30% had children under the age of 18 living with them, 59.50% were married couples living together, 9.70% had a female householder with no husband present, and 27.30% were non-families. 23.20% of all households were made up of individuals, and 9.50% had someone living alone who was 65 years of age or older. The average household size was 2.54 and the average family size was 2.99.
In the county, the population was spread out, with 25.90% under the age of 18, 7.60% from 18 to 24, 28.40% from 25 to 44, 24.80% from 45 to 64, and 13.20% who were 65 years of age or older. The median age was 38 years. For every 100 females there were 96.20 males. For every 100 females age 18 and over, there were 92.40 males.
The median income for a household in the county was $44,109, and the median income for a family was $51,169. Males had a median income of $37,357 versus $25,493 for females. The per capita income for the county was $21,669. About 5.10% of families and 6.70% of the population were below the poverty line, including 9.10% of those under age 18 and 5.60% of those age 65 or over.
2010 census[]
As of the 2010 United States Census, there were 102,506 people, 40,917 households, and 28,626 families living in the county.[12] The population density was 252.1 inhabitants per square mile (97.3 /km2). There were 44,256 housing units at an average density of 108.8 per square mile (42.0 /km2).[13] The racial makeup of the county was 94.4% white, 2.0% black or African American, 1.2% Asian, 0.2% American Indian, 0.5% from other races, and 1.8% from two or more races. Those of Hispanic or Latino origin made up 1.3% of the population.[12] In terms of ancestry, 34.5% were German, 13.5% were Irish, 10.2% were English, and 9.8% were American.[14]
Of the 40,917 households, 32.3% had children under the age of 18 living with them, 54.7% were married couples living together, 10.5% had a female householder with no husband present, 30.0% were non-families, and 25.3% of all households were made up of individuals. The average household size was 2.48 and the average family size was 2.95. The median age was 40.6 years.[12]
The median income for a household in the county was $51,507 and the median income for a family was $61,190. Males had a median income of $46,133 versus $32,699 for females. The per capita income for the county was $25,006. About 7.0% of families and 9.5% of the population were below the poverty line, including 14.0% of those under age 18 and 4.8% of those age 65 or over.[15]
Politics[]
Miami County is a Republican stronghold county in presidential elections, with Democrats winning the county only 3 times in 1912, 1936 and 1964.
| Year | Republican | Democratic | Third party | |||
|---|---|---|---|---|---|---|
| No. | % | No. | % | No. | % | |
| 2020 | 41,371 | 71.23% | 15,663 | 26.97% | 1,043 | 1.80% |
| 2016 | 37,079 | 69.84% | 13,120 | 24.71% | 2,895 | 5.45% |
| 2012 | 34,606 | 66.53% | 16,383 | 31.50% | 1,025 | 1.97% |
| 2008 | 33,417 | 63.15% | 18,372 | 34.72% | 1,126 | 2.13% |
| 2004 | 33,992 | 65.67% | 17,606 | 34.01% | 162 | 0.31% |
| 2000 | 26,037 | 60.78% | 15,584 | 36.38% | 1,220 | 2.85% |
| 1996 | 19,509 | 48.77% | 15,540 | 38.85% | 4,956 | 12.39% |
| 1992 | 19,741 | 45.90% | 12,547 | 29.17% | 10,718 | 24.92% |
| 1988 | 24,915 | 68.38% | 11,138 | 30.57% | 381 | 1.05% |
| 1984 | 26,300 | 72.42% | 9,695 | 26.70% | 320 | 0.88% |
| 1980 | 19,928 | 55.65% | 12,893 | 36.01% | 2,987 | 8.34% |
| 1976 | 18,686 | 57.65% | 13,074 | 40.34% | 653 | 2.01% |
| 1972 | 21,226 | 68.44% | 9,121 | 29.41% | 665 | 2.14% |
| 1968 | 16,997 | 50.62% | 13,228 | 39.40% | 3,352 | 9.98% |
| 1964 | 12,985 | 40.12% | 19,379 | 59.88% | 0 | 0.00% |
| 1960 | 22,151 | 65.30% | 11,770 | 34.70% | 0 | 0.00% |
| 1956 | 20,135 | 68.57% | 9,229 | 31.43% | 0 | 0.00% |
| 1952 | 19,525 | 65.11% | 10,462 | 34.89% | 0 | 0.00% |
| 1948 | 13,100 | 56.33% | 10,066 | 43.29% | 89 | 0.38% |
| 1944 | 14,751 | 58.47% | 10,476 | 41.53% | 0 | 0.00% |
| 1940 | 14,725 | 55.52% | 11,799 | 44.48% | 0 | 0.00% |
| 1936 | 11,343 | 44.86% | 12,754 | 50.44% | 1,189 | 4.70% |
| 1932 | 12,157 | 51.95% | 10,677 | 45.62% | 568 | 2.43% |
| 1928 | 16,063 | 72.80% | 5,867 | 26.59% | 136 | 0.62% |
| 1924 | 11,851 | 62.70% | 5,296 | 28.02% | 1,754 | 9.28% |
| 1920 | 13,122 | 60.28% | 8,076 | 37.10% | 572 | 2.63% |
| 1916 | 5,772 | 48.61% | 5,582 | 47.01% | 519 | 4.37% |
| 1912 | 3,615 | 32.49% | 4,310 | 38.74% | 3,200 | 28.76% |
| 1908 | 6,558 | 53.69% | 5,369 | 43.95% | 288 | 2.36% |
| 1904 | 6,793 | 62.44% | 3,646 | 33.51% | 440 | 4.04% |
| 1900 | 6,197 | 53.86% | 5,127 | 44.56% | 181 | 1.57% |
| 1896 | 6,051 | 52.60% | 5,387 | 46.83% | 65 | 0.57% |
| 1892 | 5,110 | 51.26% | 4,271 | 42.84% | 588 | 5.90% |
| 1888 | 5,312 | 53.04% | 4,258 | 42.51% | 446 | 4.45% |
| 1884 | 5,273 | 55.56% | 4,084 | 43.03% | 134 | 1.41% |
| 1880 | 4,928 | 57.33% | 3,604 | 41.93% | 64 | 0.74% |
| 1876 | 4,388 | 55.40% | 3,509 | 44.31% | 23 | 0.29% |
| 1872 | 3,753 | 56.03% | 2,910 | 43.45% | 35 | 0.52% |
| 1868 | 3,958 | 59.82% | 2,659 | 40.18% | 0 | 0.00% |
| 1864 | 3,821 | 61.94% | 2,348 | 38.06% | 0 | 0.00% |
| 1860 | 3,431 | 58.69% | 2,337 | 39.98% | 78 | 1.33% |
| 1856 | 3,171 | 59.63% | 1,988 | 37.38% | 159 | 2.99% |
Government[]
Current officials[]
- Board of Commissioners:
- Ted Mercer (R)
- Wade Westfall (R)
- Greg Simmons (R)
- County Auditor: Matthew W. Gearhardt (R)
- Clerk of Courts: Shawn Peeples (R)
- County Coroner: William N. Ginn, M.D. (R)
- County Engineer: Paul Huelskamp (R)
- County Prosecutor: Anthony E. Kendell (R)
- County Recorder: Jessica Lopez (R)
- Sheriff: Dave Duchak (R)
- County Treasurer: James Stubbs (R)
Miami County Court of Common Pleas
- Judges:
- Stacy Wall (R)
- Jeannine Pratt (R)
- Scott Altenburger(R)
Municipal Court
- Judges:
- Samuel Huffman(R)
- Gary Nasal (R)
- Magistrates:
- Gary Zuhl
Education[]
Public school districts[]
- Bethel Local Schools
- Bethel High School, Bethel Township (the Bees)
- Bradford Schools
- Bradford High School, Bradford (the Railroaders)
- Covington Exempted Village School District
- Covington High School, Covington (the Buccs/Buccaneers)
- Miami East Local Schools
- Miami East High School, Casstown (the Vikings)
- Milton-Union Exempted Village Schools
- Milton-Union High School, West Milton (the Bulldogs)
- Newton Local School District
- Newton High School, Newton (the Indians)
- Piqua City School District
- Piqua High School, Piqua (the Indians)
- Tipp City Exempted Village School District
- Tippecanoe High School, Tipp City (the Red Devils)
- Troy City School District
- Troy High School, Troy (the Trojans)
Miscellaneous education[]
The Western Ohio Japanese Language School (オハイオ西部日本語学校 Ohaio Seibu Nihongo Gakkō) is a supplementary weekend Japanese school in unincorporated Miami County, near Troy. It started in April 1988.[17]
Communities[]

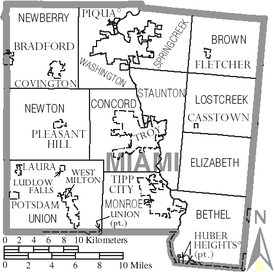
Municipalities and townships of Miami County
Cities[]
- Huber Heights (part)
- Piqua
- Tipp City
- Troy (county seat)
- Union (part)
Villages[]
- Bradford (part)
- Casstown
- Covington
- Fletcher
- Laura
- Ludlow Falls
- Pleasant Hill
- Potsdam
- West Milton
Townships[]
- Bethel
- Brown
- Concord
- Elizabeth
- Lostcreek
- Monroe
- Newberry
- Newton
- Springcreek
- Staunton
- Union
- Washington
https://web.archive.org/web/20160715023447/http://www.ohiotownships.org/township-websites
Unincorporated communities[]
- Alcony
- Bloomer
- Brandt
- Conover
- Frederick
- Garland
- Ginghamsburg
- Grayson
- Kessler
- Lena
- Phoneton
- Polo
- Rossville
- West Charleston
See also[]
- National Register of Historic Places listings in Miami County, Ohio
References[]
- ^ "Ohio County Profiles: Miami County" (PDF). Ohio Department of Development. http://www.odod.state.oh.us/research/FILES/S0/Miami.pdf.
- ^ 2020 census
- ^ "Find a County". National Association of Counties. http://www.naco.org/Counties/Pages/FindACounty.aspx.
- ^ "Miami County". https://ohiohistorycentral.org/w/Miami_County.
- ^ "2010 Census Gazetteer Files". United States Census Bureau. August 22, 2012. https://www.census.gov/geo/maps-data/data/docs/gazetteer/counties_list_39.txt.
- ^ "U.S. Decennial Census". United States Census Bureau. https://www.census.gov/programs-surveys/decennial-census.html.
- ^ "Historical Census Browser". University of Virginia Library. http://mapserver.lib.virginia.edu.
- ^ Forstall, Richard L., ed (March 27, 1995). "Population of Counties by Decennial Census: 1900 to 1990". United States Census Bureau. https://www.census.gov/population/cencounts/oh190090.txt.
- ^ "Census 2000 PHC-T-4. Ranking Tables for Counties: 1990 and 2000". United States Census Bureau. April 2, 2001. https://www.census.gov/population/www/cen2000/briefs/phc-t4/tables/tab02.pdf.
- ^ 2020 census
- ^ "U.S. Census website". United States Census Bureau. https://www.census.gov.
- ^ a b c "DP-1 Profile of General Population and Housing Characteristics: 2010 Demographic Profile Data". United States Census Bureau. http://factfinder.census.gov/bkmk/table/1.0/en/DEC/10_DP/DPDP1/0500000US39109.
- ^ "Population, Housing Units, Area, and Density: 2010 - County". United States Census Bureau. http://factfinder.census.gov/bkmk/table/1.0/en/DEC/10_SF1/GCTPH1.CY07/0500000US39109.
- ^ "DP02 Selected Social Characteristics in the United States – 2006-2010 American Community Survey 5-Year Estimates". United States Census Bureau. http://factfinder.census.gov/bkmk/table/1.0/en/ACS/10_5YR/DP02/0500000US39109.
- ^ "DP03 Selected Economic Characteristics – 2006-2010 American Community Survey 5-Year Estimates". United States Census Bureau. http://factfinder.census.gov/bkmk/table/1.0/en/ACS/10_5YR/DP03/0500000US39109.
- ^ Leip, David. "Dave Leip's Atlas of U.S. Presidential Elections". http://uselectionatlas.org/RESULTS.
- ^ "本校概要" (Archive). Western Ohio Japanese Language School. Retrieved on May 11, 2014.
External links[]
| Wikivoyage has a travel guide for Miami County (Ohio). |

|
Shelby County | Champaign County |
| |
| Darke County | ||||
 Miami County, Ohio | ||||
| Montgomery County | Clark County |
| ||||||||||||||||||||

, Coordinates:
|